Why $20K a Year Changes the Retirement Math More Than You Think

I turned 50 at my favorite splurge steakhouse, one of the fancy ones with a white tablecloth, a multi-page bourbon list, and a wine list that feels like an encyclopedia. I was surrounded by friends and family, celebrating a half century of life on this earth and dreaming about what the second half would look like. I can still remember the sizzle of the 1,400-degree steak being served, a table full of side dishes passed around, and sharing a delicious dessert with a plateful of spoons. Most of all, I remember feeling appreciated, valued, and loved by the people who matter most.
What I didn't expect was what came next.
In the days that followed I found myself more nostalgic than expected. I'd been jokingly describing what turning 50 felt like as being on the "back nine of the golf course of life." But when I sat with it more honestly in my journal, I realized that if most men live into their mid-to-late eighties, I was somewhere around the twelfth hole.
Something else I was wrestling through was that I'd always assumed I would work until 62 or 65. At 50, working until 65 started to feel less like a plan and more like a prison sentence I hadn't agreed to serve. For most of my career I had truly loved the work. There was a season in my late thirties and forties when I had what the Japanese call ikigai, the overlap of what you love, what you are good at, what the world needs, and what you can be paid for. I would have done it for free. But something shifted over time. The work that had mattered so much slowly became what it cost: the health, the early mornings, the Sunday nights, the vacations planned around project timelines, with the leisurely mornings that were hard to find.
So I did what I always do when something financial grabs me: I opened the spreadsheet, not to model a retirement date but to figure out how to build a life raft. I was already contributing to every tax-advantaged account I could find: the 401K, the HSA, and the Roth IRA. At 50, I decided to push much harder on the taxable brokerage, not because I had a clean exit plan but because I understood the terrain well enough to know I might need accessible funds in my mid-to-late fifties whether I chose that timing or not. In Corporate America, the exit doesn't always arrive on your schedule. Reorgs, layoffs, synergies, redundancies: they take excellent, well-liked, talented people with no warning and no ceremony. I'd watched it happen too many times to assume I was immune forever.
That was the protection move. The possibility move came two years later.
At 52, I started modeling a Next Endeavor (or NE, as we'll call it throughout), not to replace my salary or build a second career but to find the number that changes the math without consuming the life. When I ran scenarios at larger income levels, the results were eye-opening: earning significantly less than a full-time income could move the probability of retirement portfolio success by ten percentage points or more and pull a viable retirement date forward by several years.
Then the bigger surprise arrived. Adding simple guardrails to my plan, like skipping an inflation adjustment the year after a negative market return or reducing spending by a fixed percentage after a significant correction, meant that even $20,000 of modest NE income could make a dramatic impact, not because the dollar amount was large but because it showed up during the decade when every withdrawal does its most lasting damage.
The income doesn't have to be large. It doesn't have to be permanent. It just has to show up during the years when it matters most.
This post is the math behind that finding. Three real households. Three different income levels. One consistent truth: a modest start and a slow ramp changes everything.
The Decade That Decides Everything
Most retirement planning tools assume a fixed average rate of return, something like 7% or 10% per year, every year, like clockwork. The problem is that markets don't work that way, and the order in which returns arrive matters enormously. Sequence of returns risk, or SORR, is the math most people skip entirely, and it's the concept that determines whether your plan actually holds up in the years when it's most vulnerable.
The first decade or so of retirement is the SORR window, whenever that decade begins. Every dollar withdrawn during that period at a depressed portfolio value does permanent damage. Every dollar not withdrawn during that window compounds for decades.
This is why a small amount of earned income during those years has an outsized mathematical effect. Ten or twenty thousand dollars not taken from a portfolio at fifty-five doesn't just save ten or twenty thousand dollars. It compounds for thirty-five years.
A generation ago, a pension did this job automatically. It started the day you stopped working and bridged the gap to Social Security without touching the portfolio. Almost nobody has that anymore. But the mathematical need for a bridge hasn't disappeared. The Next Endeavor is how you build one yourself.
What We Mean by a Next Endeavor
Before the math, a word on what we mean by a Next Endeavor.
A Next Endeavor is meaningful, enjoyable, flexible work you genuinely want to do, not a second career or a demanding new job. It's the kind where you set the schedule, choose the clients, and take weeks off when the grandkids visit or the mountains are calling. Ten to twenty hours a week on average, some weeks more and some weeks nothing at all, seasonal by design and ramping up and down with life rather than fighting it. For the full philosophy behind why this kind of work changes both the math and the meaning of the second half of life, How FI Led Me to FINE is the right place to start.
Before the Numbers: What Actually Varies
The most interesting variable across these three households isn't portfolio size or spending. It's NE capacity: how much meaningful flexible income each household can realistically generate and what percentage of their spending it covers. You'll meet all three households in a moment.
One note on how the numbers work. A Monte Carlo simulation runs the same retirement thousands of times against thousands of different random market sequences, then reports how often the money lasted. A 79% success rate means the portfolio survived to age 90 in roughly four runs out of five.
Worth knowing what "failure" means in a model like this: a retiree who kept spending at full rate into a collapsing portfolio for a decade and never adjusted. Real people adjust. Which is the point: the side income determines whether that adjustment is voluntary or forced.
For full methodology, see the Geek Out Corner at the bottom of the post.
Dana and Rick, 55: The Biggest Rescue
Rick spent thirty-three years as a mechanic at a Nissan dealership. Honest work done well in a clean shop on cars he understood. What he genuinely loved was the diagnostic work: tracking down the noise that didn't match the manual, finding the root cause hiding behind three other symptoms. He was good at it in the way only three decades of doing one thing makes a person good.
Then his body started keeping a different account. The sciatic nerve, the hands that no longer bent and flexed the way they once did, the slow accumulation of physical cost that doesn't announce itself one morning but arrives gradually until the work that built a career becomes the limitation that ends one.
Dana taught math and science at a private school for thirty-two years, building her retirement entirely through a 403(b) that grew through decades of modest contributions and patient compounding. There was no pension.
They'd always planned to work into their early sixties. That plan ended when Rick's body made a different decision, and Dana wanted to be there to help him through the transition rather than keep teaching while he managed alone. Their exit was not chosen. It arrived.
Together they have $1,120,000, spend $72,000 a year, and a withdrawal rate of 6.43%. Their savings rate over a career was roughly 15%, more than most people manage. They did the right things and still ended up at 15.6 times spending rather than 25 times. That isn't failure. It's what ordinary, disciplined saving produces for most households when life changes the timeline.
Without a Next Endeavor, their Monte Carlo success rate is 79.4%, the most vulnerable starting point in this post. Roughly one simulation in five ends in portfolio depletion before age 90. In real life, that looks like the big trip postponed and then quietly cancelled. The week at the beach that was non-negotiable until it wasn't. Flights to see grandchildren becoming less frequent, then shorter. Cars kept longer than wisdom would recommend. Fast food more often than leisurely meals with friends. Every one of us has seen him: the older man greeting shoppers at Walmart who looks like someone whose retirement plan ran out before he did. He's the end of this spiral made visible.
What saves Dana and Rick isn't a larger portfolio. It's their NE capacity.
A mobile mechanic bills $60 to $80 an hour. A math tutor runs $40 to $50. Two people with hands-on skills working part-time can generate $40,000 at peak, covering 56% of their spending. That's the highest NE capacity of the three households, and it produces the biggest rescue in the post.
Rick can't crawl under cars anymore, but he can sit on a stool and diagnose. His teenage son handles the undercar work now, oil changes and filter swaps for neighbors and family friends, while Rick handles everything above the frame. They'd restored a 1989 Nissan 240SX together over eighteen months, the same model Rick drove in high school, and word got around. What started as a hobby became a natural next endeavor for both of them, a father passing along thirty-three years of diagnostic wisdom to a son who's still learning what he knows. Dana tutors math in the summers she always structured her life around, now choosing her students rather than inheriting a roster. She's tutoring the younger sister of a student she loved teaching a decade ago, and the private school still calls her to substitute occasionally. She sees her old colleagues in the hallways and remembers why she loved the work before the full-time schedule stopped being optional. They travel in March and September, when crowds are thin and prices are lower.
NE ramp: $20,000 in year one, building to $40,000 by year three, held through age 62, tapering to zero by 67 as Social Security arrives.
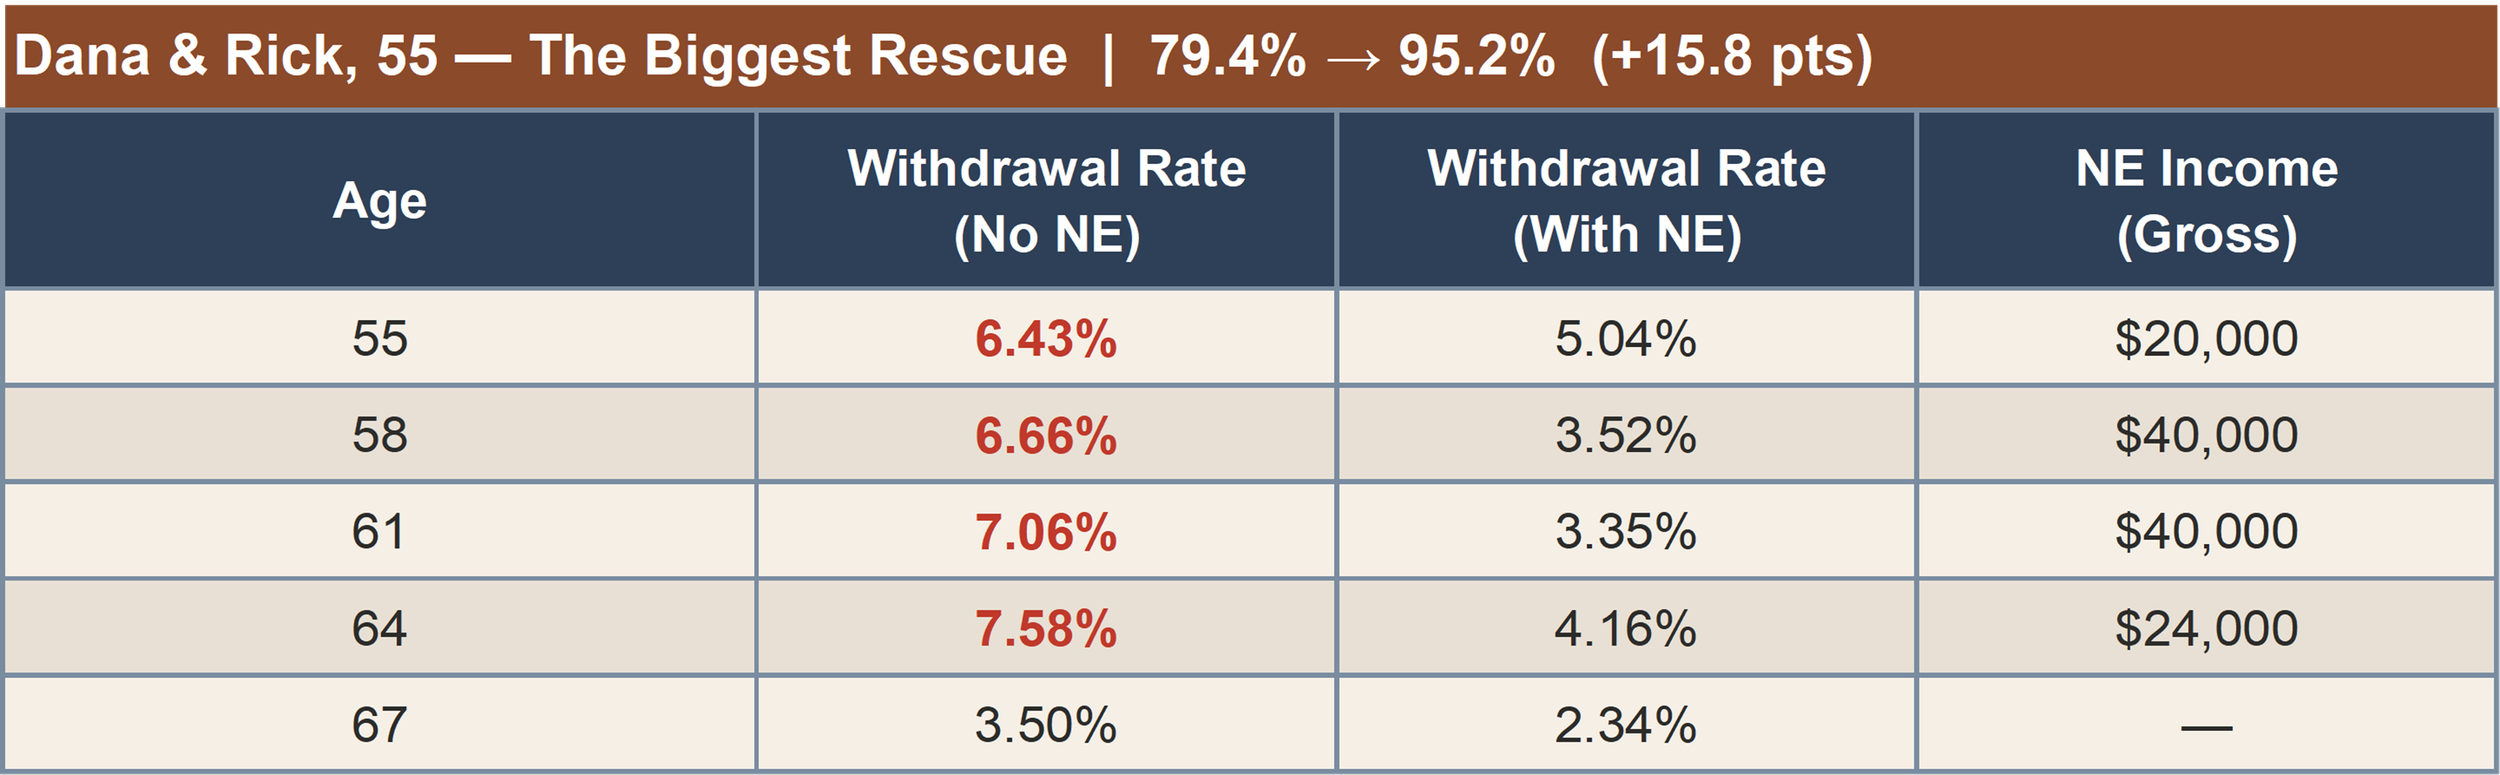
Without NE: 79.4%. With the ramp: 95.2%. A gain of 15.8 percentage points.
The no-NE column spirals upward year after year as the portfolio shrinks faster than spending grows. The NE column never exceeds 5.04% of portfolio value. That spiral in the left column isn't just a number. It's Rick at 63 wondering whether they made a mistake leaving when they did.
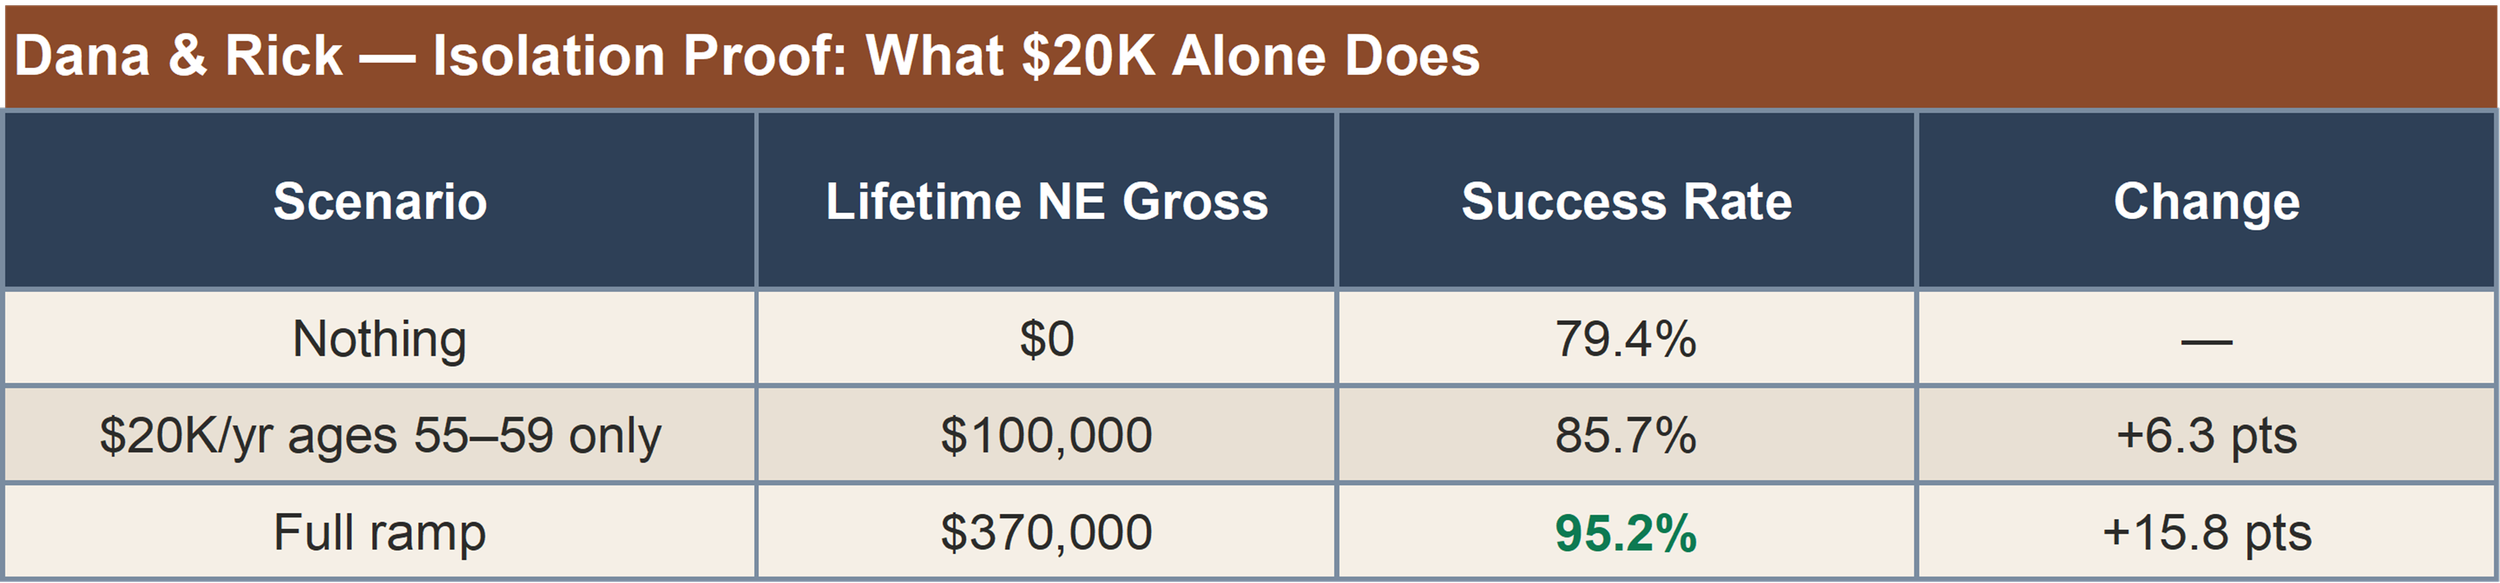
Five years of $20K moves them from 79% to 86%, meaningful progress but not enough on its own. Their story requires the full ramp because their starting position is the most fragile. High NE capacity is what makes the full ramp possible.

Priya, 55: When the Ceiling Is the Constraint
Priya's life looked very different from Dana and Rick's. The daughter of South Asian immigrants, she was the first in her family to complete a graduate degree. She was also the first to stay single into her fifties, focused on a career that she'd built methodically over two-plus decades navigating the regulatory landscape of a large hospital system. She'd dated, but somehow never found the partner who clicked, and somewhere along the way stopped waiting for that to change.
She didn't plan to leave at 55. The buyout arrived and the math of staying became complicated.
She retired with $980,000, spending $58,000 a year at a 5.92% withdrawal rate, with Social Security of $32,000 arriving at 67. Single, she carries one income stream, no spousal benefit, and the full SORR burden alone. Her Social Security replaces only 55% of her spending, compared to 58% for Dana and Rick. Single filers carry more of the SORR burden without a partner's income or benefit to share the load.
Without a Next Endeavor her success rate is 85.1%, better than Dana and Rick's starting point. But her NE capacity tells a different story.
Priya is a solo specialist in a narrow field. Compliance consulting doesn't scale the way two people with tools can. Project-based work has a natural ceiling. Her peak NE income is $20,000, covering only 34% of her spending. That's the lowest NE capacity of the three households despite her having the strongest credentials.
Her credentials open doors immediately. Twenty-five years of compliance expertise is exactly what a smaller hospital needs and can't afford to hire full-time. She keeps one hospital client on retainer, takes a policy review project each year, and teaches a single section of healthcare administration at the community college because she enjoys it more than she expected. She's genuinely good at this work and genuinely wants to do it, on her terms, at her pace. The work keeps her connected to a field she spent years mastering and gives her something to say yes to when she feels like it, and no to when she doesn't.
NE ramp: $15,000 in year one, building to $18,000 in year two, and $20,000 by year three, held through age 62, tapering to zero by 67.
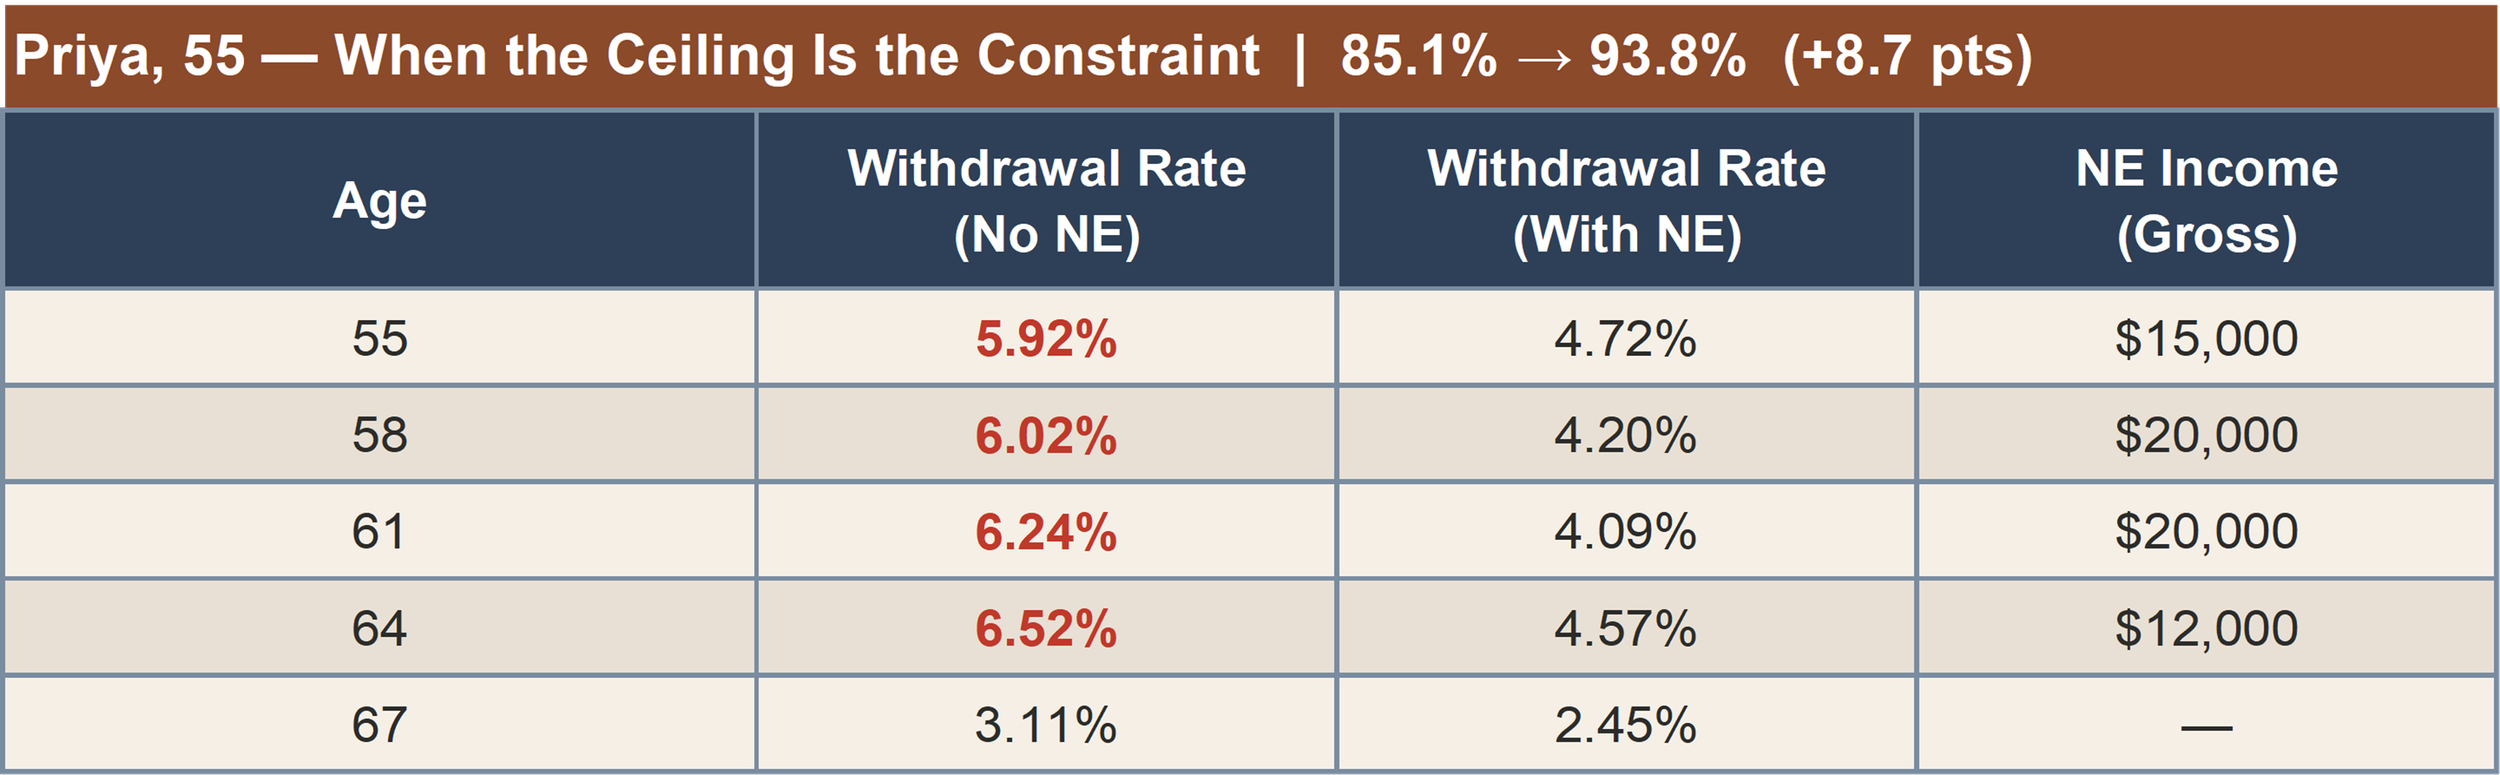
Without NE: 85.1%. With the ramp: 93.8%. A gain of 8.7 points.
For a single person without a partner to share the anxiety with, watching that left column would be a lonely kind of dread. The NE income doesn't just change the math. It changes what Sunday evenings feel like.
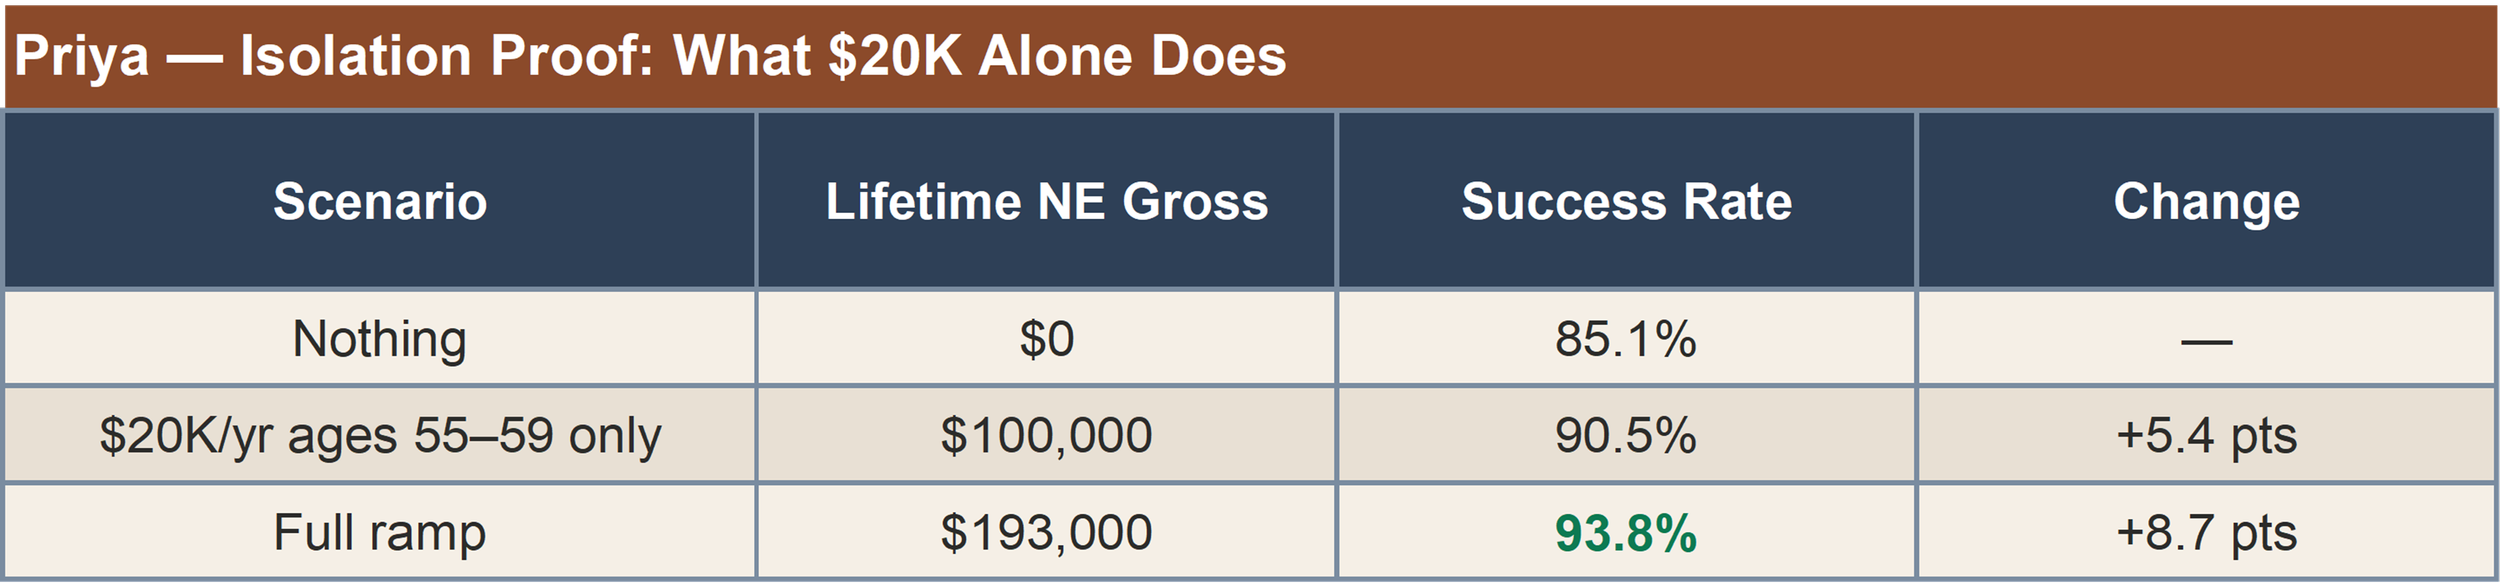
Five years of $20K takes Priya from 85% to 91%, crossing into the range most financial planners consider comfortable territory. The full ramp only carries her to 94%. Her ceiling is her constraint, not her portfolio. The same $100,000 that leaves Dana and Rick short at 86% does most of the work for Priya.
Mark and Nancy, 54: Buying Optionality
Mark spent thirty years in corporate finance, the kind of career built on relationships as much as numbers. He knows which CEOs pick up the phone on the first ring and why, and that network took three decades to build. Nancy spent twenty-five years in critical care nursing, the kind of work that demands everything and gives back something most professions can't: the clarity that comes from knowing you showed up when it mattered most.
They leave together with $2,600,000, $143,000 in annual spending, and a 5.50% withdrawal rate. Combined Social Security at 67 is $68,000.
Their starting position is the strongest of the three at 88.8% without a Next Endeavor. They're not in danger. What they're buying with the NE income isn't survival. It's optionality: the ability to help their adult children with first vehicles and someday a down payment on a home, a few more generous trips in their sixties if the portfolio is running ahead of schedule, and the freedom to make every major financial decision from a position of strength rather than necessity.
Mark's corporate network is a depreciating asset and he knows it. His phone rings loudest in year one, when the relationships are freshest and his knowledge most current. So the ramp is front-loaded: $70,000 in year one, peaking at $80,000 through ages 55 and 56, declining steadily as the network naturally thins. He takes board advisory work because it's genuinely interesting and keeps him sharp, not because the plan requires it. He's choosy about which calls to take, and that selectivity is itself part of what the Next Endeavor gives him.
Nancy still picks up per diem nursing shifts when a colleague needs coverage. Twenty-five years of caring for people in crisis doesn't switch off cleanly, and she doesn't ask it to. She also teaches one semester a year at the nursing school because passing along what she knows matters to her in a way she didn't fully anticipate until she tried it.
NE ramp: $70,000 in year one, peaking at $80,000 through ages 55 and 56, then declining steadily to $10,000 by 65 as the network thins.
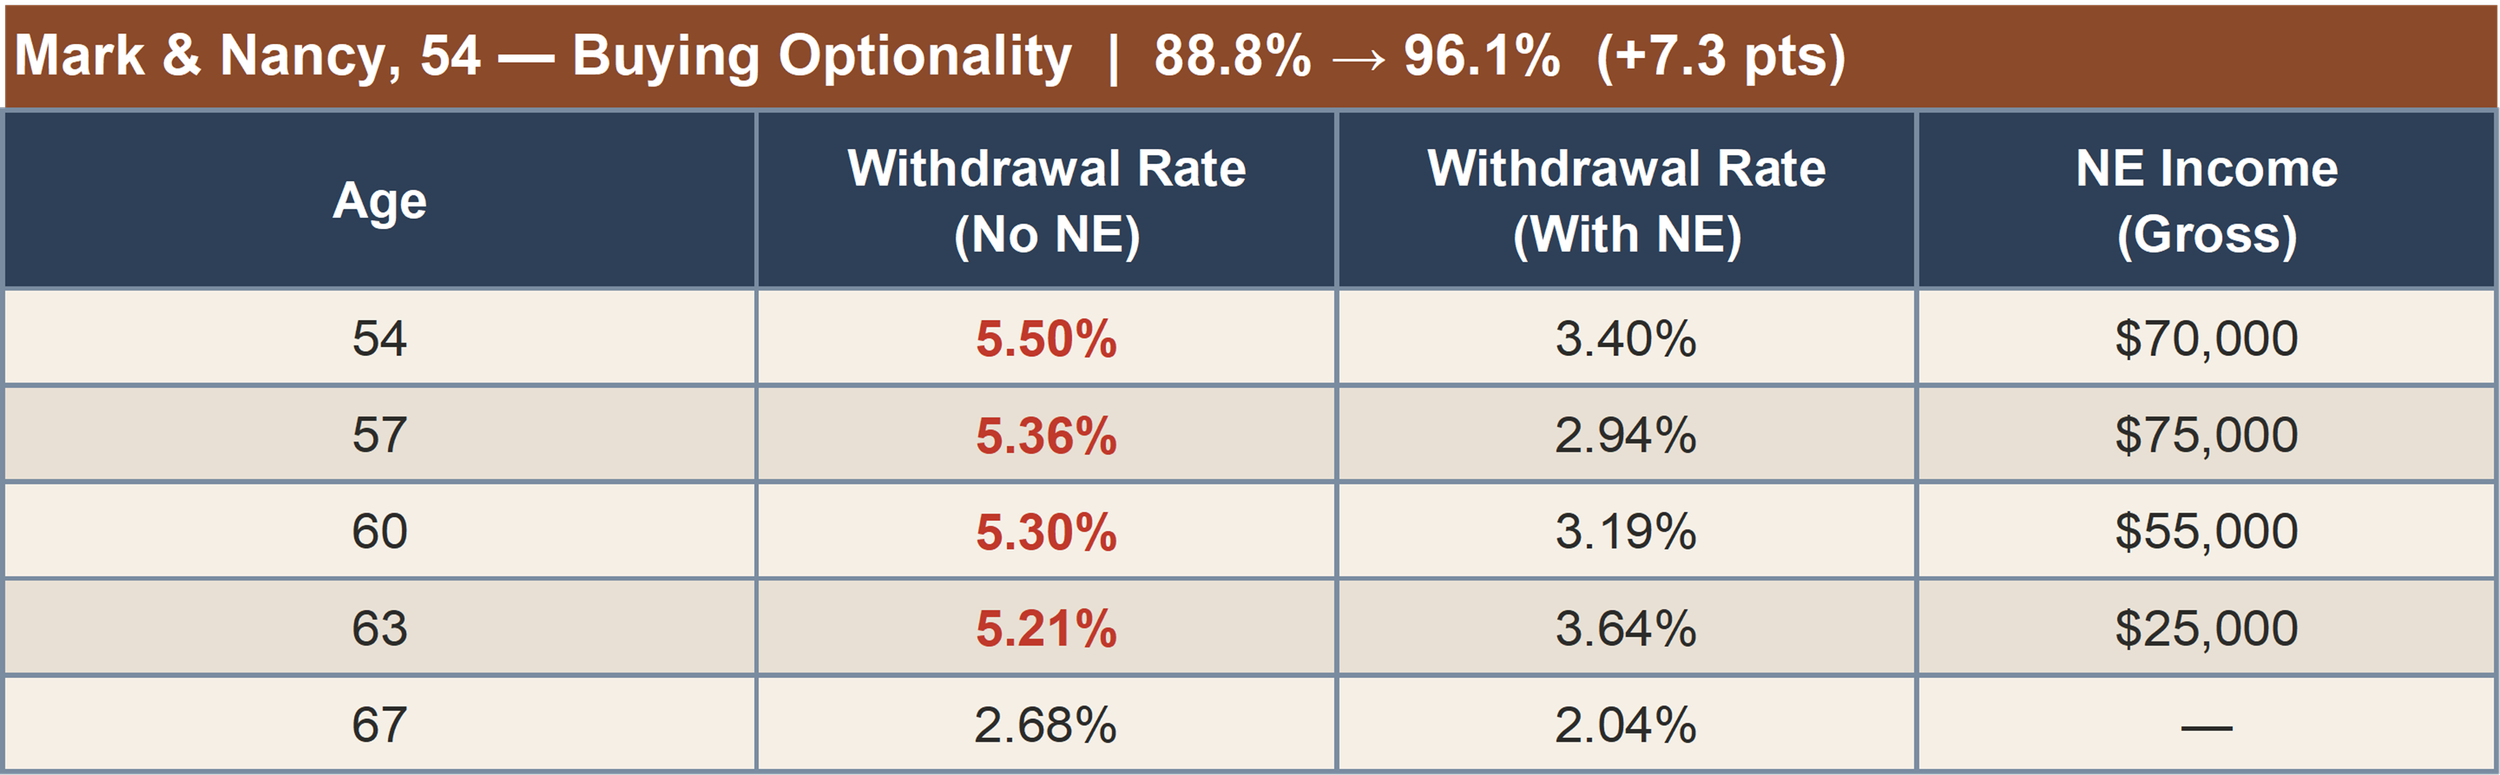
Without NE: 88.8%. With the ramp: 96.1%. A gain of 7.3 points.
Notice their no-NE column falls rather than climbs. That's what a plan looks like when it isn't in danger. Dana and Rick's spirals up to 7.58%. Mark and Nancy's drifts down on its own.
The ramp is a plan, not a contract:
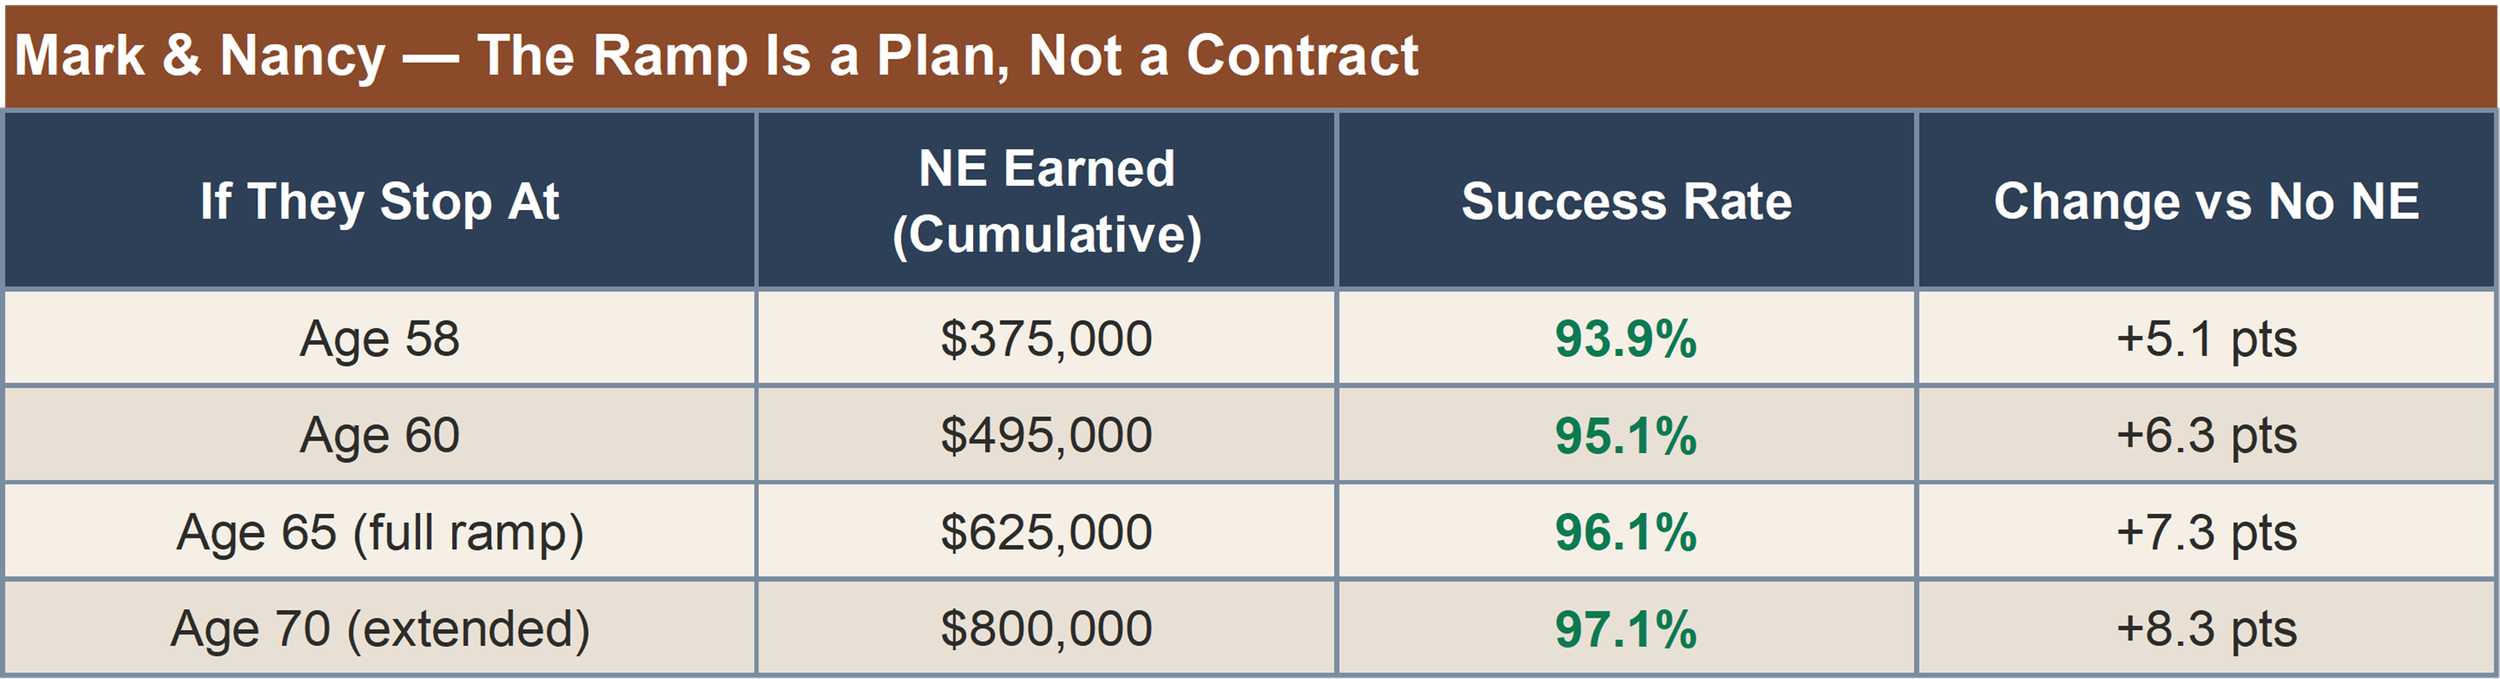
Every stopping point clears 90%. Mark and Nancy never have to commit in advance to how long they'll work. If markets run strong through 58, they stop and take the six-week trip they've been talking about for a decade. If the first three years are rough, they keep the phone on. The decision gets made one year at a time, with information they don't have today.
That optionality is the part a spreadsheet can't show and a retirement date can't give you.
The same $100,000 that leaves Dana and Rick short, and carries Priya across the line, moves Mark and Nancy from 88.8% to 90.5%. They were already fine. For them the NE income isn't about reaching safety. It's about reaching certainty.
What the Numbers Are Actually Saying
Three households. Three completely different situations. Three different answers to the same question.
Dana and Rick needed the full ramp because their starting position was the most fragile and their NE capacity was the highest. The rescue required both.
Priya needed five years of modest consulting and not much more. Her ceiling limited what was possible, but her ceiling was enough. The same $100,000 that leaves Dana and Rick short of 90% carries Priya past it.
Mark and Nancy were never in danger. What they bought was the right to decide one year at a time without the plan forcing their hand. None of these three reached an ending. They entered a new season, and retirement works that way whether you choose the timing or life chooses it for you. From the River to the Corner Office is the longer version of that idea.
The variable that made the difference in each case wasn't the portfolio size or the spending level. It was what each household could plausibly earn during the decade when it matters most, and what percentage of their spending that income displaced.
Your capacity matters as much as your portfolio. That's the insight the 25x rule doesn't capture and the Next Endeavor makes possible.
The Bridge You Build Yourself
Rick's father retired at 62 with a pension that started the day he stopped working and ran until he died. He never thought about sequence of returns risk because he never had any. The pension was the bridge, built automatically by decades of showing up, handed over without paperwork on the last day of work.
Dana and Rick don't have that. Almost nobody in their generation does. What they have instead is a garage, a set of tools, a high school son who learned from watching, and thirty-three years of knowing how to diagnose a problem nobody else could find.
That's the bridge now. You just have to build it yourself.
The good news is that building it doesn't require a large year one. It doesn't require replacing your salary or committing to a decade of demanding work. It requires a modest start, a natural ramp, and enough patience to let the math work during the decade that decides everything.
Dana tutors. Rick diagnoses. Priya consults. Mark takes the calls while they still come. Nancy teaches.
None of them is working in any traditional sense. None of them have fully stopped. The line between those two things has become, for each of them, exactly as blurry as they want it to be.
That's what the ramp buys. Not just a better probability table. Slow mornings. Mondays and Fridays that belong to you. Travel in the off-season when the prices are lower and the crowds are gone. Work you choose because it interests you, with people you like, on a schedule that fits around the life rather than the other way around.
The math gets you to the starting line. The ramp gets you through the first decade. What comes after is the life you built all of this for.
There's an old parable about a man who tears down his barns to build bigger ones, determined to store everything he's accumulated and finally rest. He dies that night. The story isn't really about barns. It's about what happens when accumulation becomes the entire point.
Rick isn't building bigger barns. He's passing thirty-three years of diagnostic wisdom to a son who is still learning what he knows. Dana is teaching the younger sister of a student she loved, back at the school by invitation, seeing old colleagues in the hallways. Nancy is still showing up for patients not because the plan requires it but because the work matters to her in a way that doesn't stop when the paycheck does. Mark is using three decades of financial expertise to help a smaller business thrive, without the politics or the pressure of proving something.
The Next Endeavor, when it's chosen freely and built from what you genuinely love, is the opposite of the bigger barns. It's using what you've been given in service to something beyond yourself, for as long as you want to, on your own terms.
A couple of questions worth considering:
When is your current plan on track to let you stop full-time work, and is that timeline one you chose or one you inherited by default?
If life changed your timeline the way it changed Rick's, what kind of Next Endeavor could you build from what you already know and love?
Let's make wise choices and live a great life together.
🌵Desert FI
Want to go deeper?
Become a Desert FI Insider. A modest Next Endeavor can change the math, and you can test it on your own numbers. Insiders get Weekend Reflections every Sunday morning plus free Insider-only resources like the FINE Number Calculator. If you’re not on the trail with us yet, join at DesertFI.org/join.
Already an Insider? Here are three posts worth exploring:
How to Find Your Next Endeavor: five paths to meaningful work
The Seven Signs You’re Ready for a Next Endeavor: how to tell whether you’re ready or just tired
The Sequence That Determines Whether Your Retirement Lasts: on sequence of returns risk and how to protect against it
Geek Out Corner
Each scenario uses assumptions appropriate to that household's likely allocation. Dana and Rick and Priya are modeled as 60/40 portfolios at a 6% arithmetic mean with 12% standard deviation, compounding to approximately 5.3% real after volatility drag. Mark and Nancy are modeled as 70/30 at 7% arithmetic with 13% standard deviation, compounding to approximately 6.2% real. All use 10,000 Monte Carlo simulations, spending held constant in real terms with no guardrails or spending cuts, Social Security claimed at 67, Next Endeavor income taxed at 22% combined self-employment and income tax, and a terminal age of 90. Within each scenario the only variable that changes is the Next Endeavor income. Three Households methodology: the portfolio assumptions, compounding rates, standard deviations, and tax treatment above apply uniformly. The only difference between the No NE and With NE columns in each scenario is the presence or absence of Next Endeavor income. Everything else is held constant: market sequence, spending, Social Security timing, and terminal age.

NE capacity (what a household can plausibly earn) matters as much as portfolio size. Dana and Rick have the smallest portfolio and the largest rescue because their capacity is highest relative to spending. Priya has the better ratio of the two smaller households and the lower outcome, because a solo specialist cannot scale the way two people with tools can.